


Executive summary
U.S. power demand is in its first sustained period of growth since the mid-2000s, and investors have bid up generation and utility assets: deal value reached $205 billion in the first half of 2026, and gas-fired capacity has more than doubled in price in two years. However, roughly 2,060 GW of new generation and storage is waiting for a grid connection, the typical project completed in 2025 had waited more than five years, and Texas alone is processing about 474 GW of large-load connection requests (many of them speculative). Scarcity has moved from generation to delivery, and customers with capital and a deadline (hyperscalers first, with large-scale manufacturers close behind) are building or contracting power at their own sites rather than waiting for a connection date.
The solution to the energy bottleneck isn’t grid build-out, it’s grid circumvention, and that’s not where most of the capital is yet. Megafunds have started to finance onsite assets, but the capability to design, install and service them at scale is still fragmented and largely valued at contractor multiples. This paper sets out how those customers are going around the bottleneck and which positions should hold their value once grid access improves.
The energy value chain today
For roughly fifteen years U.S. electricity demand was flat, and the industry organized itself around that fact. Utilities planned for replacement more than for growth, generation investment followed policy and fuel prices, and the customer’s role was largely limited to paying the bill. Utility forecasts compiled by Grid Strategies in November 2025 now put five-year peak load growth at 166 GW (up from 24 GW three years earlier), with roughly 90 GW attributed to data centers.4 Some of this is likely overstated, since developers often file the same project with several utilities, but even after Grid Strategies’ own discount of roughly 25 GW, about 140 GW remains, which is growth the system has not had to absorb in decades.
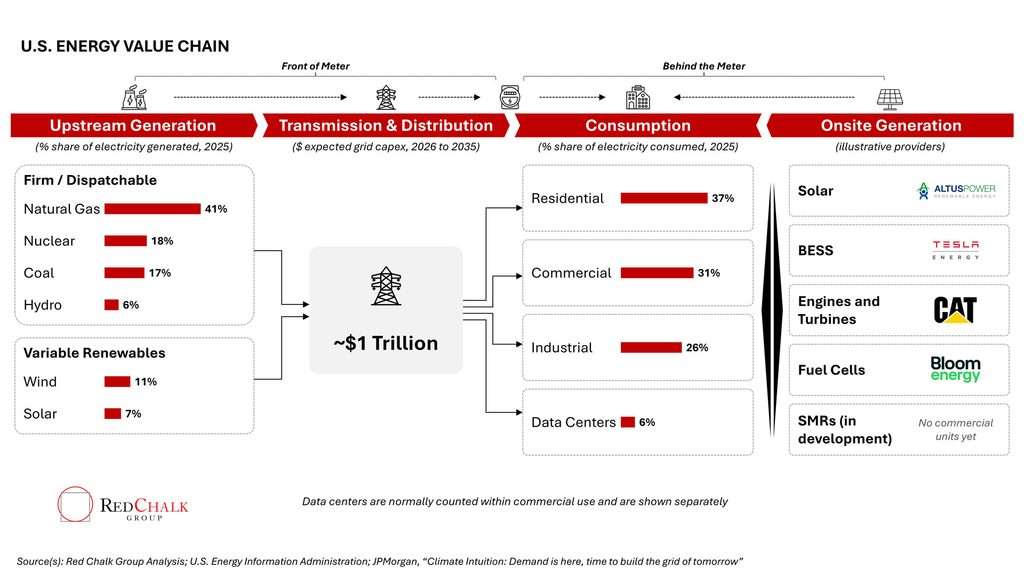
To see where that growth meets a constraint, it is useful to view the system as four linked segments, two in front of the customer’s meter and two behind it (see Figure 1):
- Upstream generation: firm or dispatchable sources produced most U.S. electricity in 2025 (natural gas 41%, nuclear 18%, coal 17% and hydro 6%), with wind and solar contributing the remaining 18%. Much of this segment is open to competition, and it has drawn the largest share of recent deal capital.
- Transmission and distribution: the regulated network that moves power from plant to customer. Grid capital spending is expected to total roughly $1 trillion from 2026 to 2035, yet what gets built, where, and who pays for it are decided through planning processes and rate cases, which run on a different clock from a customer’s project schedule.
- Consumption: residential, commercial (excluding data centers) and industrial customers accounted for 37%, 31% and 26% of electricity use in 2025. Data centers accounted for about 6% and could reach 9% to 17% by 2030, which makes them the fastest-growing source of demand.
- Onsite generation: solar, battery storage, engines, gas turbines, fuel cells and (still in development) small modular reactors installed on the customer’s side of the meter. Long a niche of rooftop solar and backup generators, this segment now includes plants of several hundred megawatts built to carry a site’s full load.
The first three segments sit in a line, and until recently power moved along that line in one direction, from the plant through the network to the customer. Onsite generation changes the picture because it allows a customer to meet part or all of its needs with power that never touches the traditional grid network.
Figure 1: The U.S. Energy Value Chain
The delivery bottleneck
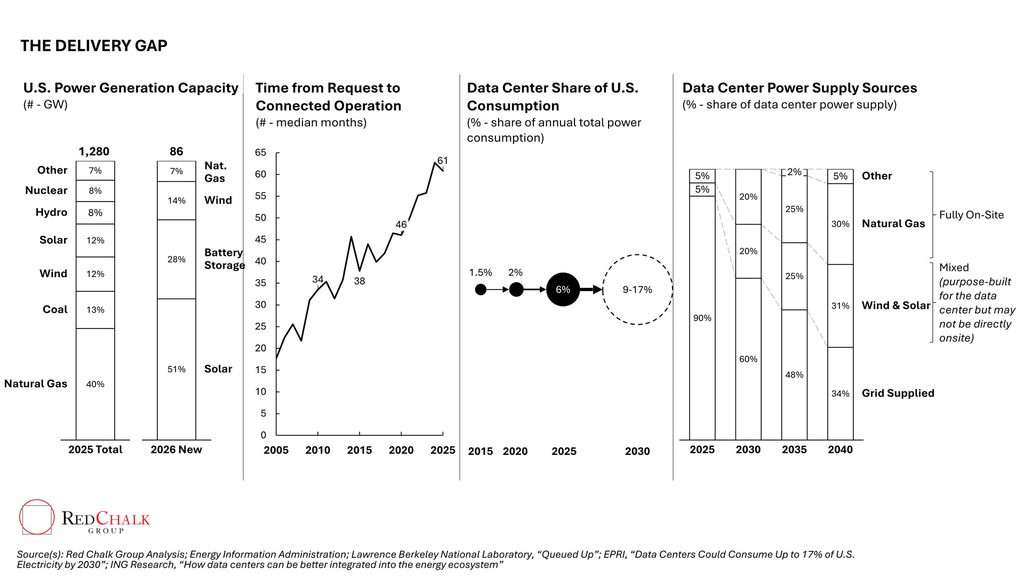
For several years the working assumption across much of the industry was that generation was the constraint, but the data points to the network. The United States has about 1,280 GW of installed generating capacity and is on track to add a record 86 GW in 2026, about 80% of it solar and battery storage (see Figure 2). Behind those additions sits a far larger pool of projects waiting for a connection: Berkeley Lab counts about 2,060 GW of generation and storage in interconnection queues at the end of 2025, more than one and a half times everything installed today. That total is down from a peak of nearly 2,600 GW two years earlier, after more than 750 GW of requests were withdrawn in 2025. Of what remains, 549 GW already holds a draft or signed interconnection agreement and is still not operating, equal to more than six years of additions at the 2026 pace.
The median time from interconnection request to commercial operation has more than tripled, from about 18 months in 2005 to 61 months for projects completed in 2025 (see Figure 2), and of the capacity that entered queues between 2000 and 2020, only 13% has been built. Not all of that attrition is the network’s doing, since many requests are speculative, but projects with agreements in hand are waiting too.
Figure 2: The Delivery Gap
Customers now meet the same delay from the other direction. In Texas, ERCOT’s queue of large-load connection requests reached about 474 GW by August 2026, roughly 90% of it from data centers. That is more than five times the grid’s record peak demand, and many of the requests are speculative. Regulators have replaced project-by-project studies with batch studies, but a state-ordered audit of data center proposals has delayed the first batch, whose transmission plan had been due in fall 2027.
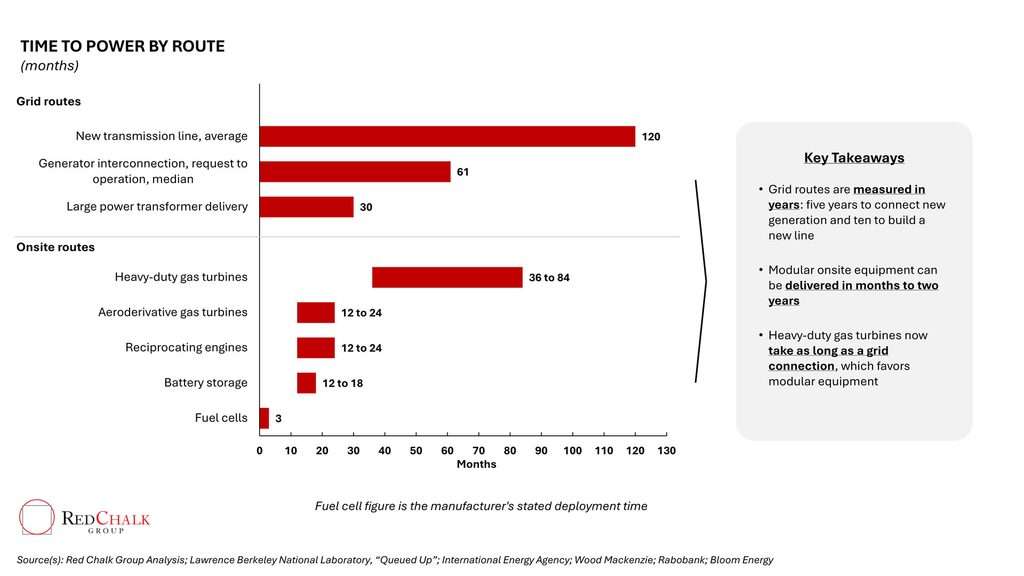
Equipment adds a further constraint. Wood Mackenzie estimated a 30% supply deficit for power transformers in 2025, with about 80% of U.S. supply imported, prices up 77% since 2019 and lead times for large units of about 128 weeks (see Figure 3). Much of the network those units connect to is also aging (the Department of Energy has put 70% of transmission lines and power transformers at more than 25 years old), so new connections and replacement programs draw on the same factories and the same crews.
The cause of these delays lies in how the network is governed more than in any lack of effort by utilities. Every large connection triggers studies of its effect on the system, the resulting upgrades must be planned, permitted and sited, and their cost must be allocated among customers through a regulated process. Those steps protect reliability and ratepayers, and they take years (a new transmission line can take a decade), while the customers driving new demand build on schedules of two years or less. A developer can secure land, capital, chips and a customer and still have no date for power.
Figure 3: Time to Power By Route
Circumvention and the rise of energy as a service
When the wait for a connection is longer than the business case can tolerate, the alternative is increasingly to put generation where the load is. Most onsite options (heavy-duty gas turbines are the exception) can be brought online within two years, much faster than five years for the typical generation project to clear the queue (see Figure 3), and that difference is changing how the largest customers buy power.
We use the term circumvention for this, with one qualification: it seldom means going without the grid altogether. Some onsite systems are built as permanent primary supply and others as a bridge, and most sites still want a grid connection, as a hedge against price and outage risk or as a route to sell capacity back (e.g., demand response).
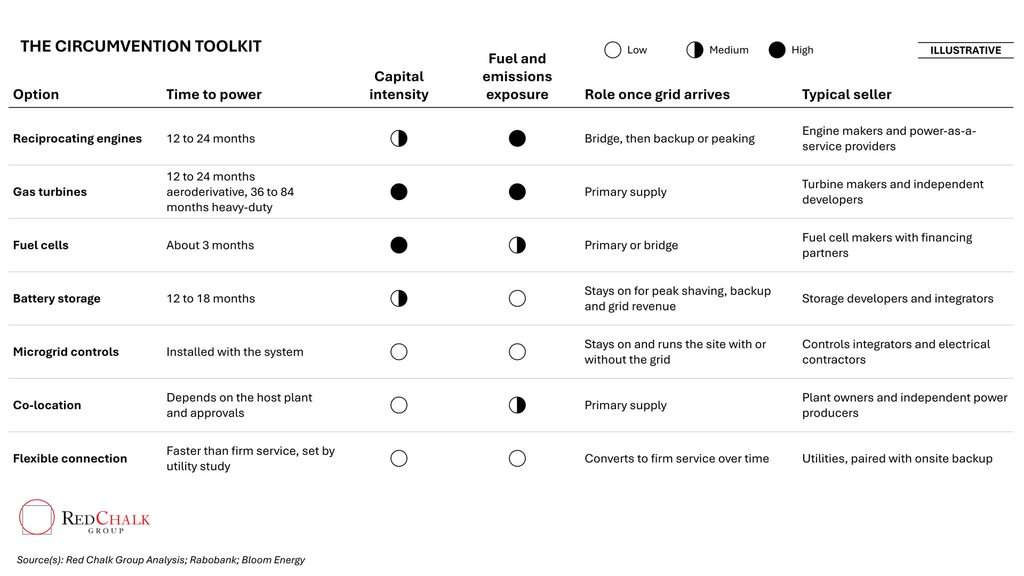
The ways to circumvent the grid fall into five options, which differ in speed, cost, fuel exposure and role once grid power arrives (see Figure 4):
- Onsite generation, meaning reciprocating engines, gas turbines and fuel cells installed at the load. Williams is building five behind-the-meter gas projects totaling more than 2.6 GW, including the 200 MW Socrates plant in Ohio that serves Meta, and Bloom Energy’s fuel cells are being deployed for Oracle, Equinix and American Electric Power.
- Battery storage, which ensures reliable onsite power supply, reduces peak draw and prevents downtime due to unforeseen grid events. A site able to cover its own peak is also easier for a utility to connect.
- Microgrids and controls, meaning the switchgear, protection and energy management that allow generation, storage and load to operate as a single system with or without the grid.
- Co-location, where new load is sited beside an existing power plant so that power does not have to cross the network, under rules regulators are still writing.
- Flexible connection, where a customer accepts curtailment at peak in exchange for a faster connection (an option Texas now offers large loads), usually with onsite power or storage to fall back on.
Grid power accounts for about 90% of data center supply today, and that share is projected to fall to about 60% by 2030 and 34% by 2040, with fully onsite supply (mostly gas) rising from about 5% to about 35% and dedicated wind and solar making up the rest (see Figure 2). Developer intent points the same way: in Bloom Energy’s April 2026 survey of 156 data center decision-makers, 61% said they would deploy onsite power as their primary strategy when grid power is the bottleneck, and only 12% would relocate.Bloom sells onsite power, so we treat the survey as directional, although independent estimates are consistent with it (Jefferies expects behind-the-meter supply to meet 25% to 33% of incremental data center demand through 2030).
The more consequential change is in the business model. Most customers would rather buy a delivery date and a price than own or operate a power plant. That has created room for a provider that finances, builds, owns and operates the system and sells its output under a long-term contract, a model usually described as energy as a service and already visible at scale in Williams’ projects for Blackstone. The contracts resemble infrastructure (long tenors, creditworthy counterparties), while the capabilities resemble those of an industrial services business (engineering, procurement, electrical installation, fuel logistics, controls and maintenance). Few companies have both capabilities today, and we expect much of the next wave of consolidation to form around closing that gap.
Figure 4: The Circumvention Toolkit
Capital and the battle for capacity
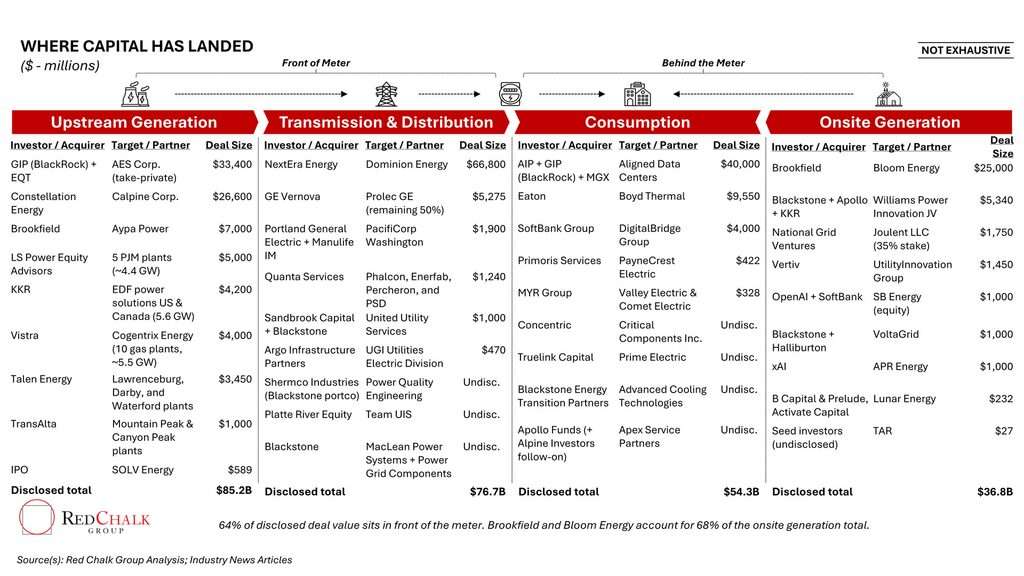
So far capital has gone mostly to assets in front of the meter, and in very large transactions: 64% of the disclosed deal value in Figure 5 sits there. Of the $205 billion in first-half 2026 power and utilities deal value, ten transactions above $1 billion made up 97%, led by the NextEra and Dominion merger and the AES take-private.1 Brookfield's agreement in July 2026 to buy the storage platform Aypa Power at a $7 billion enterprise value shows the same appetite for grid-connected assets.13 Gas-fired plants changed hands at $1,468 per kW in the first half of 2026, compared with $675 per kW in 2024.1 When an asset class doubles in price in two years and the buyers include the largest infrastructure managers in the world, it is difficult to describe a position there as differentiated.
The same managers have begun to move behind the meter, and their transactions are the strongest evidence that the circumvention thesis is being taken seriously.
- Brookfield and Bloom Energy: a $5 billion framework to fund onsite fuel cell power for data centers (October 2025) was expanded to $25 billion in July 2026.10
- Blackstone, Apollo, KKR and Williams: a Blackstone-led consortium committed $5.34 billion for a 49% interest in Williams' five behind-the-meter gas projects.9
Even so, onsite generation is only about 15% of the disclosed total in Figure 5, and two-thirds of that is the Bloom framework, a commitment to fund projects and not a completed acquisition.
These commitments buy assets, and they leave the capacity to deliver them (the firms that design, install, integrate and service onsite power) fragmented, largely private and mostly too small for a megafund. That is starting to change: Figure 5 shows strategics such as Quanta, Primoris and MYR Group buying electrical contractors, and Blackstone building positions in grid services and components. We expect the constraint to surface here next, because every onsite project requires electricians, switchgear, controls and commissioning, all of which are already stretched by data center and grid work.
Pricing in this layer has started to move, although unevenly. By one sector advisor's estimate, electrical contractors with data center and mission-critical capability are trading at 8x to 12x EBITDA, against 5.5x to 8x for general contractors of similar size, and at least a dozen private equity firms are looking for a first platform.14 The re-rating has so far reached only the businesses with an obvious label. The adjacent ones (power distribution assemblers, engine and fuel cell service providers, controls integrators, and developers of onsite projects below 100 MW for industrial customers) are where the opening is, because megafunds are financing the assets while the capability to build and run them is still largely valued as contracting.
Figure 5: Where Capital Has Landed
The durability question
Any thesis built on a bottleneck must address what happens when the bottleneck eases. Four risks stand out, each of which changes what is worth owning.
- Faster grid access: in June 2026 FERC ordered all six regional grid operators to justify or revise their rules for connecting large and co-located loads,15 and the generation queue has already shrunk from its 2023 peak.2 Quicker connection would reduce the scarcity value of pure bridge power, although reform changes the process and leaves the physical work (building transmission, taking delivery of transformers) as it was.
- Constraints on the alternatives: large gas turbines have become as hard to obtain as a grid connection. GE Vernova reported 116 GW of backlog and slot reservations at mid-2026 against roughly 20 GW of annual output,16 and Siemens Energy has a 69 GW backlog with lead times of three years or more.17 This favors modular equipment that can be delivered within two years and the companies able to source and install it.
- Demand below forecast: if utility forecasts overstate data center load by the 25 GW Grid Strategies estimates,4 the most speculative projects will fall away first. Exposure concentrated in one hyperscale customer or one site carries that risk directly, while a service business spread across many customers and load types carries far less.
- Onsite power carries a cost premium over grid electricity, which customers willingly pay to bypass delays. However, their willingness to pay drops significantly once a grid connection becomes available. Onsite gas also faces air permitting and local opposition, and regulators have yet to settle how much self-supplying customers should contribute to the shared network.
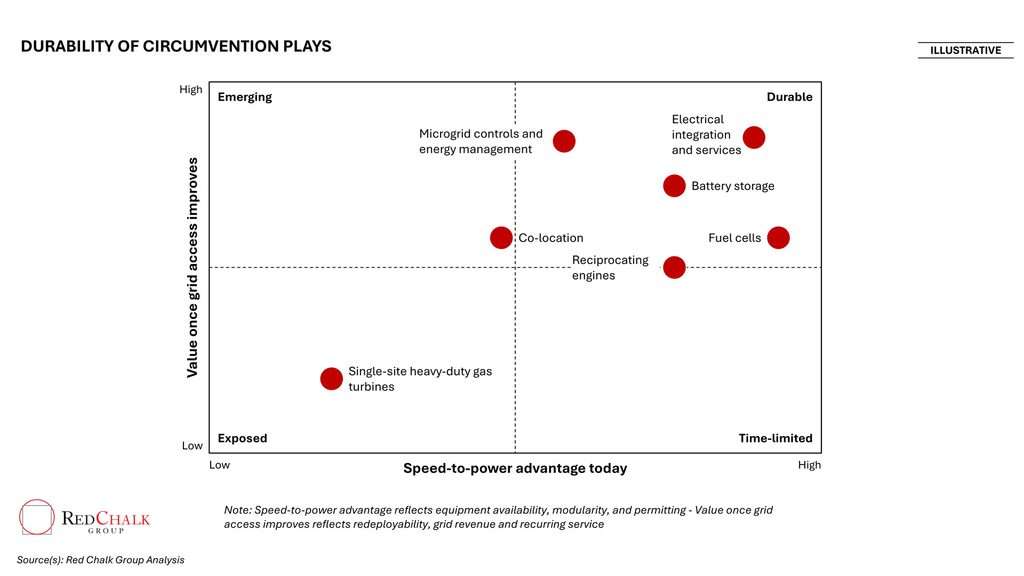
None of these looks likely to close the window this decade, given ten-year transmission timelines and turbine order books that run past 2030. Together they point to a simple test of durability: what does the asset or business do once the grid arrives? A turbine serving a single customer is only as durable as its contract, and beyond that term it is a wager that the delay persists. A fleet of modular units that can be redeployed, a battery that earns grid revenue, or a services firm that installs and maintains all of these should continue to earn as the constraint moves (see Figure 6).
Figure 6: Durability of Circumvention Plays
Implications for investors
For investors, the shift from generation to delivery changes the question worth asking. The useful question is which businesses are exposed because power is late, which are paid because of it, and for how long. Five implications follow, and they apply differently depending on where an investor sits.
- Assess the existing portfolio for bottleneck exposure. Any growth plan that assumes a new facility, an expansion or fleet electrification also assumes a connection date, including at companies nobody regards as energy businesses. Operating and value creation partners should establish which plans carry that assumption, what equipment is on order, and whether an onsite route would protect the timeline.
- Look past the consensus trade. A generation or renewables thesis now competes on price with the largest pools of capital in the world. For fund partners and deal teams, a differentiated position is more likely to be found in businesses whose revenue rises with time-to-power pressure and which are still valued as contractors, distributors or equipment assemblers. We would favor capability over single assets, several load types over a single hyperscale name, and contracted cash flows over assumptions about how long the delay lasts.
- Add onsite power capability to services platforms. Electrical contractors with mission-critical experience are already being re-rated. Platforms (and their sponsors) that now add engine and fuel cell installation, storage integration, controls and long-term service are assembling an energy-as-a-service offer at contracting multiples.
- Match patient capital to mid-sized projects. Long-contract onsite power for mid-sized industrial customers is too small for megafunds and too slow for fast money, which suits family offices and other capital able to hold for a decade, build direct relationships with operators and underwrite the customer's credit.
- Decide on build or buy while pricing power lasts. Equipment makers and specialist contractors hold order books that will shorten once new factories open. For strategics, the time to reprice, secure supply and acquire capability is while the queue is long.
For customers, the race that matters is getting power delivered on their timeline, and the companies best positioned to do that aren’t yet where most of the capital is flowing. Red Chalk Group works with investors and operators across the value chain to identify which companies are navigating this bottleneck most effectively and which portfolios are most exposed to it. Contact us to learn more.
Footnotes
- Deloitte, “Power and utilities M&A 2026 midyear update”
- Lawrence Berkeley National Laboratory, “Queued Up: 2026 Edition”
- Utility Dive, “Texas, facing 438 GW queue, approves initial large-load interconnection process”; Utility Dive, “ERCOT aims to complete Texas governor’s data center audit by December”; ERCOT, “Yearly Peak Demand Records”
- Grid Strategies, “National Load Growth Report 2025” (November 2025)
- U.S. Energy Information Administration, “Electricity explained: Electricity in the United States” (https://www.eia.gov/energyexplained/electricity/electricity-in-the-us.php)
- U.S. Energy Information Administration, Short-Term Energy Outlook (retail sales by sector); EPRI, “Powering Intelligence 2026” (https://esca.epri.com/products/3002034696/). Commercial share excludes data centers, based on Red Chalk analysis.
- Wood Mackenzie, “Transformer troubles: manufacturing and policy constraints hit US transformer supply”
- U.S. Department of Energy, Grid Deployment Office, Transmission Division overview
- Data Center Dynamics, “Blackstone invests $5.34bn in Williams’ behind-the-meter natural gas power projects”
- Power Engineering, “Brookfield, Bloom Energy expand partnership to $25 billion framework for onsite data center power”
- Bloom Energy, “2026 Data Center Power Report” (mid-year)
- Latitude Media, “Behind-the-meter generation is picking up traction”, citing Jefferies
- Blackstone, “Brookfield to Acquire Aypa Power”
- John M. Salony, “Who Is Buying Electrical Contracting Companies in 2026?”
- McGuireWoods, “FERC Issues Section 206 Show Cause Orders” on large load integration
- Turbomachinery Magazine, “GE Vernova’s Gas Turbine Backlog Hits 116 GW”
- Utility Dive, “Siemens Energy’s gas turbine backlog nears 70 GW”


